SQL Server 2019, Row Mode Memory Grant Feedback
Hy Guys,
Are you ready for another post? Today we will discuss about another new feature introduced by the last SQL Server 2019 that is called Memory Grant FeedBack for Row Mode.
Enjoy the reading mate!
A recap!
Just to recap what we are talking about in these last posts and where we have arrived.
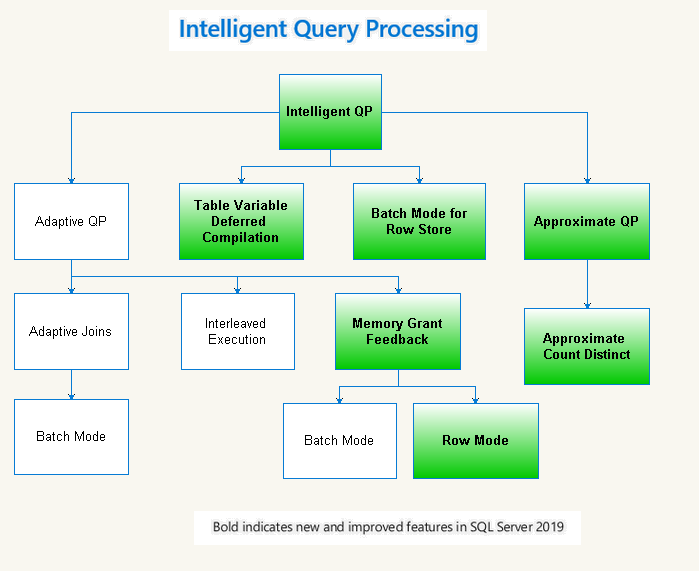
In the past posts we have seen what are the new features introduced by SQL 2019. We have addressed all but one.
We have talked about:
- Table Variables deferred compilation
- Batch Mode on Rowstore
- Approx_Count_Distinct function
- (we also talked about the OPTIMIZE FOR SEQUENTIAL KEY clause)
So, what subject do we still have to talk about? well..
Memory Grant FeedBack for Row Mode
Many times we have focused on performance. We want to get a Query that is quick to execute and that reads as few pages of memory as possible.
This certainly remains true!
However, there is another aspect to focus on: the use of memory.
Obviously memory is a limited resource and the more the queries require memory the less we will be able to execute at the same time.
We can see how much memory our Query is using simply from the execution plan looking to the Memory Grant row:
The SQL Server optimizer also warns when the estimated memory for execution turns out to be greater than the actual one: we always check if a yellow triangle appears in the execution plan.
The question is. How can we solve problems of this type?
SQL Server 2017 has introduced the memory grant feedback feature to avoid this problem but it only worked only in batch mode.
Today SQL Server 2019 also introduces it for the more common Row mode!
This time I will explain the details of how it works during the test!
The Test
As usually we will do some tests to verify all this theory and also to go into more detail, so follow me mate!
As usual we will use our test tables that have already been used many times.
We want to test both SQL Server 2017 and SQL Server 2019. Since we already have SQL 2019 installed, we will set a compatibility level of 140 to replicate the behavior of SQL Server 2017.
TEST ON SQL SERVER 2017
Before each test we also empty the cache.
ALTER DATABASE SCOPED CONFIGURATION CLEAR PROCEDURE_CACHE;
ALTER DATABASE memorygrant SET COMPATIBILITY_LEVEL = 140
Then type this following very simple Query:
SELECT * FROM ORDRIG C ORDER BY C.IDCUSTOMER
Running the query we obtain this execution plan:
TEST ON SQL SERVER 2019
Now let's move to SQL server 2019 to see what happens!
We run the commands below to clear the cache and to set the native compatibility level:
ALTER DATABASE SCOPED CONFIGURATION CLEAR PROCEDURE_CACHE;
ALTER DATABASE memorygrant SET COMPATIBILITY_LEVEL = 150
Then run the original T-SQL "simple" command:
SELECT * FROM ORDRIG C ORDER BY C.IDCUSTOMER
Running this command we have this execution plan:
The warning sign is still here and memory used is yet 6656KB!
Oh, what's up? what can be missing?
We forgot to set the "magic" option:
ALTER DATABASE SCOPED CONFIGURATION SET ROW_MODE_MEMORY_GRANT_FEEDBACK = ON
Then run again the original Query again for the second time
SELECT * FROM ORDRIG C ORDER BY C.IDCUSTOMER
Urrà!
This time in the execution plan we no longer have the warning sign!
...and used memory drop to 1536 KB..
This option works, we used less memory!
But how does it works in detail? a.k.a. "...some more theory"
Using the option ROW_MODE_MEMORY_GRANT_FEEDBACK we have activated a feedback mechanism: After each run used memory is compared to the Granted memory and then the Granted memory is adjusted accordingly. This is the trick!
More in detail we can see that in the MemoryGrantInfo section a new property called IsMemoryGrantFeedBackAdjusted is added.
This property can have 5 different values: NoFirstExecution, NoAccurate Grant, NoFeedback disabled, YesAdjusting and YesStable.
Looking to the photo above, When we ran the query for the second time, its value changed from NoFirstExection to YesAdjusting!
If now we execute our Query again (so for the third time) we can see that we reach a stable state: In this case the value of the IsMemoryGrantFeedBackAdjusted is YesStable.
Tipically the IsMemoryGrantFeedBackAdjusted states used are these:
But it can happen that SQL Server never fails to reach a stable state. For example because the memory used keeps growing or decreasing continuously.
In this case SQL Server can disables memory grant feedback. IsMemoryGrantFeedBackAdjusted property will be set to NoFeedbackdisabled.
Finally the last value that the property IsMemoryGrantFeedBackAdjusted cound have is NoAccurateGrant. Well simply feedback is not activated because SQL Server nailed the correct memory! (used memory is at least 50% of the granted memory and there is not spill to disk)
P.S. Could this be another reason to switch to SQL 2019?
Luca Biondi @ SQLServerPerformance blog 2021!Next post:
Previous post: SQL Server, better performance with the NOCOUNT option


Comments
Post a Comment