SQL Server Monitoring. A look at Redgate's SQL Monitor
Welcome back!
Today we talk about SQL Server monitoring speaking about a software produced by redgate, a software company based in Cambridge, England.
Redgate's SQL Monitor is not a free software but is a good choice for administratoes to perform Server monitoring, alerting. Let take a look!
Introduction
When you need to monitor a huge number of SQL Server installations using a specially developed software is a good choice.
I anticipate you the main pros of this products: The easy and clear interface available through a web interface. I like also it's customizable metrics.
But now let's play a bit with the Redgate's SQL Monitor thanks to the free 14-day trial version.
An easy installation
Yes, installation is easy.
Just download the executable from the redgate official site at https://www.red-gate.com
The executable needs to be runned as administrator:
Accept the license agreement e press next button:
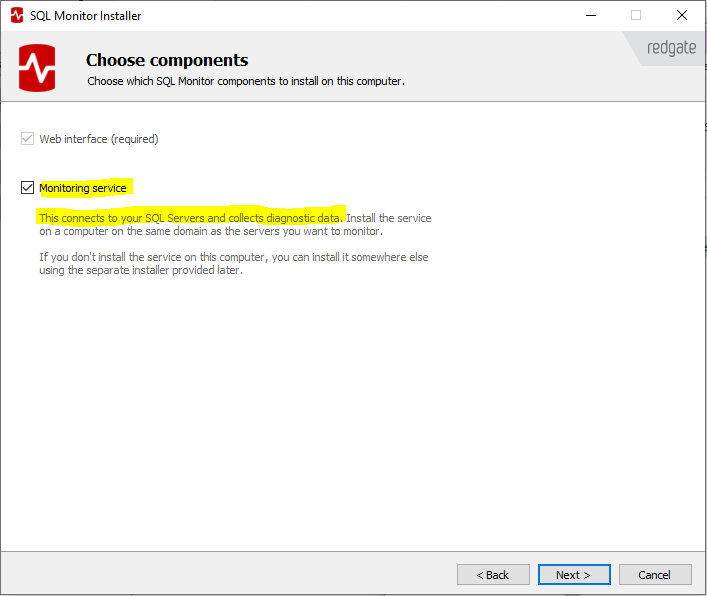
The program will be installed as a windows service:
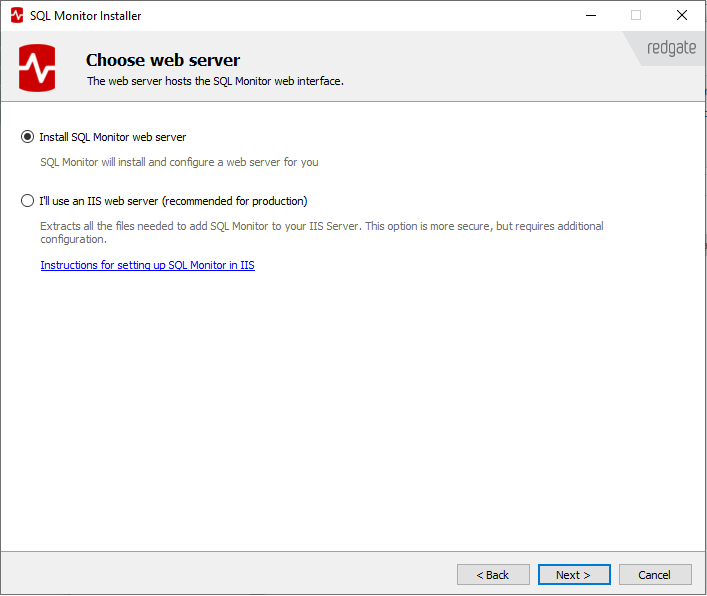
Now choose if install the interface as a web server or using an IIS web server.
Again some impostation.
Now click on the botton: allow access:
As others Monitoring tool also this redgate products store informations retrieved into a SQL database.
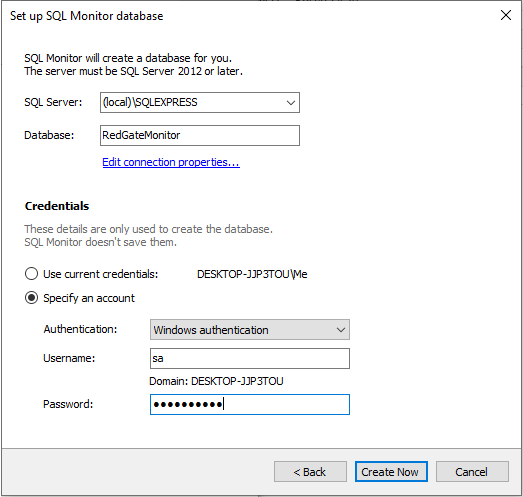
You can specify if use an existing database or create a new database:
For this review i choose to create a new database.
I must specify connections data such as the name of the instance and username and password:.
Again some steps:
And finally the latest step:
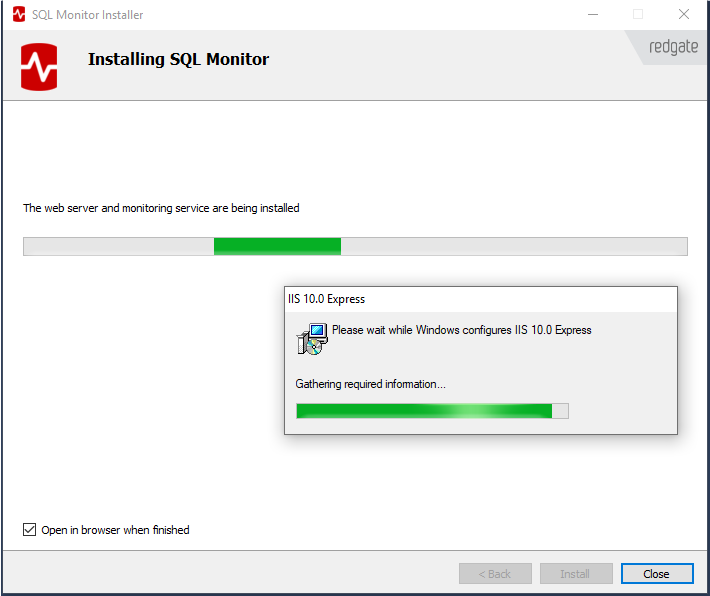
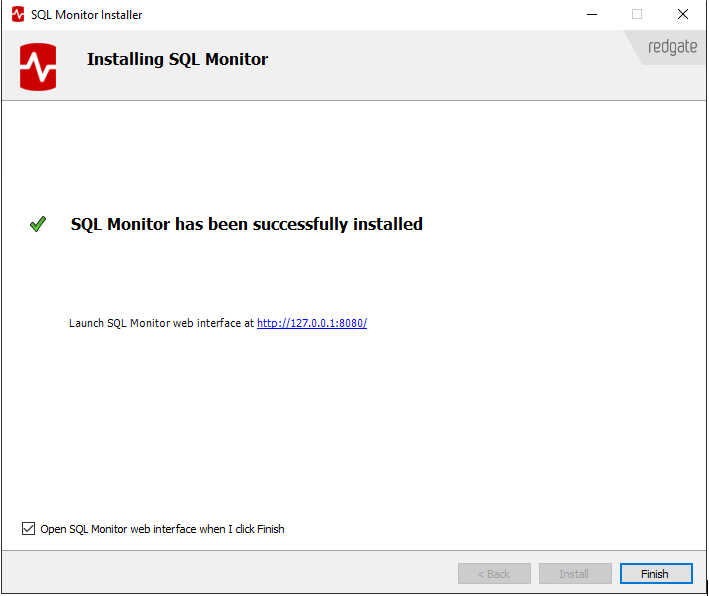
The installation come to an end!
Using the Redgate's SQL Monitoring software
Now we will take a look to this SQL Monitoring tool.
You can access though a web interface at local address 127.0.0.1:8080
During the the access you must define a password:
On the main window press the button "Add a monitored instance" ... to add a monitored instance.
Adding a SQL Server instance is also easy, just add the name of the instance:
Play a bit with the SQL Server Monitor
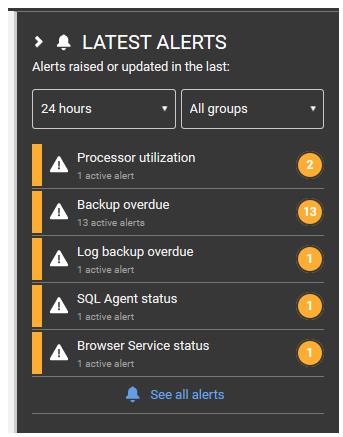
Added your instance, we can notice immediately a list of alerts:
Alert are fully configurable, so you can define your own.
How to add Metrics and Alerts
The Metric management is what i liked more.
Adding a new your metric is really an easy process.
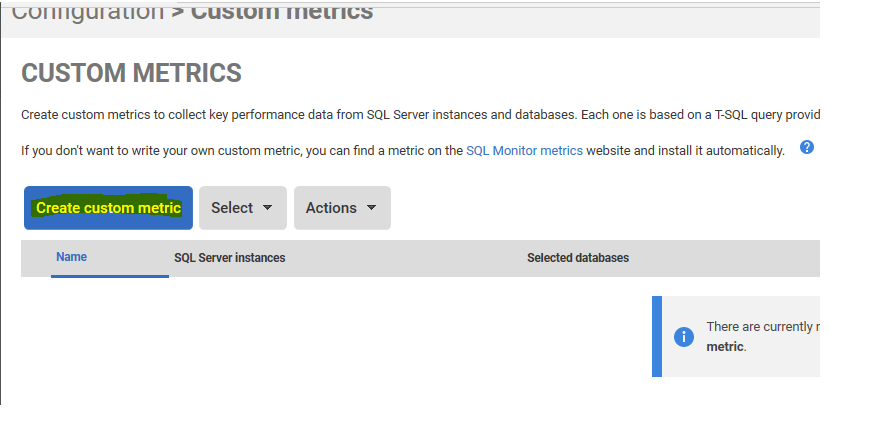
Just click on Custom metric button:
Press "create custom metrics" button
Add metric's name and a description
Now enter in the box the T-SQL query used to collect data.
For example, you must provide a script in this form:
DECLARE @Target_Data XML =

          (

          SELECT TOP 1 Cast(xet.target_data AS XML) AS targetdata

            FROM sys.dm_xe_session_targets AS xet

              INNER JOIN sys.dm_xe_sessions AS xes

                ON xes.address = xet.event_session_address

            WHERE xes.name = 'MonitorTempDBContention'

              AND xet.target_name = 'ring_buffer'

          );

SELECT Sum(duration)

FROM

  (

  SELECT

    Convert(datetime2,

        SwitchOffset(CONVERT(datetimeoffset,xed.event_data.value('(@timestamp)[1]', 'datetime2')),

        DateName(TzOffset, SYSDATETIMEOFFSET()))) AS Thedatetime,

    xed.event_data.value('(data[@name="duration"]/value)[1]', 'int') AS [Duration]

  FROM @Target_Data.nodes('//RingBufferTarget/event') AS xed (event_data)

  )f(TheDateTime,Duration)

WHERE Convert(CHAR(17),TheDateTime,113)

       = Convert(CHAR(17),DateAdd(MINUTE,-2,GetDate()),113)
Redgate software use extended events in order to record all the SQL Server activity.
From the SSMS i create an extended event called MonitorTempDBContention.
IF EXISTS --if the session already exists, then delete it. We are assuming you've changed something

  (

  SELECT * FROM sys.server_event_sessions

    WHERE server_event_sessions.name = 'MonitorTempDBContention'

  )

  DROP EVENT SESSION MonitorTempDBContention ON SERVER;

GO

CREATE EVENT SESSION MonitorTempDBContention

ON SERVER

  ADD EVENT sqlserver.latch_suspend_end

    (WHERE([sqlserver].[database_id] = (2)))

  ADD TARGET package0.ring_buffer

WITH

  (MAX_MEMORY = 4096KB,

EVENT_RETENTION_MODE = ALLOW_SINGLE_EVENT_LOSS,

MAX_DISPATCH_LATENCY = 30 SECONDS, MAX_EVENT_SIZE = 0KB,

MEMORY_PARTITION_MODE = NONE, TRACK_CAUSALITY = OFF,

STARTUP_STATE = ON);

GO

ALTER EVENT SESSION MonitorTempDBContention ON SERVER STATE = START;

GO
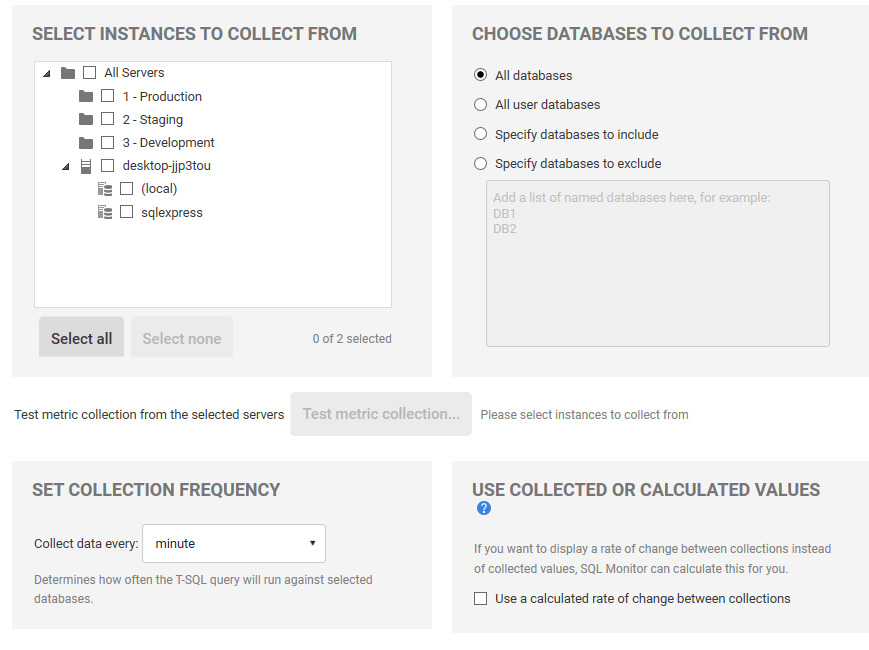
Setup up some other options to specify for example on which sql istance or on which databases apply the metric just created:
You can choose to create also an alarm:
Finally you will view your new metric in the metric list grid:
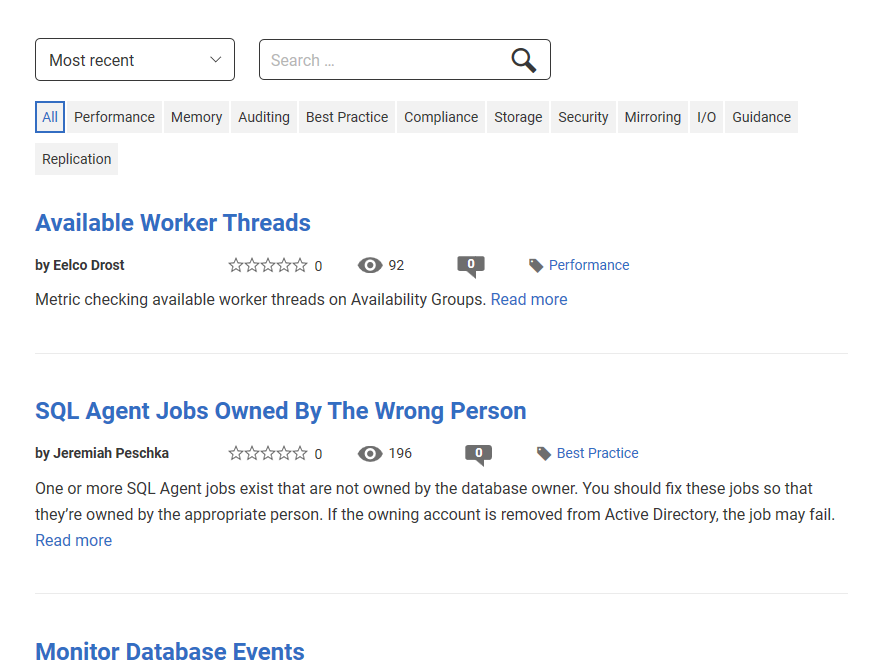
You can also choose a metric inside a list of metric already prepared by other users.
I like these metric that are really very interesting.
To search a metric simply press the Find custom metrics button.
You will be able to search inside a huge number of metrics
Yes, I must admit that metrics available are really really interesting.
So if you are a DBA this software deserve atleast a test!
That's all for today.
I wish you an awe June.
Stay connected and subscribe to this blog!
Luca














Comments
Post a Comment